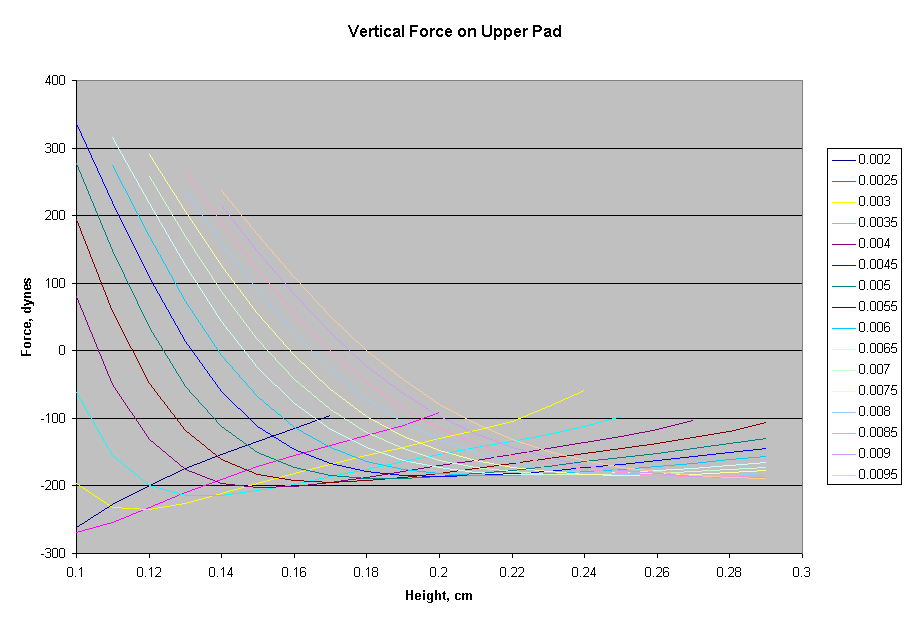
BGA-4 Vertical Force Chart
This chart was produced from data generated by the runforce command, as invoked by the chartdata command in the datafile bga-4.fe. Each curve represents a separate volume, ranging from 0.002 to 0.0095. Only data in the stable range of heights are shown for each curve.

Last Updated on 3/12/99
By Kenneth A. Brakke
Email: brakke@susqu.edu

